FAQ
HYPACKに関する質問
2.測量準備と補正(Preparation & Calibration)
ID.*Q2-2
Q. RTK GPSによる潮位補正(Using RTK GPS in HYPACK for Real Time Water Levels)[英語]
A.
Summary: Real Time Kinematic (RTK) GPS receivers can measure the latitude, longitude and height above the WGS-84 reference ellipsoid to within a few centimeters. Using this vertical accuracy, users can determine water level corrections (tide corrections). This eliminates the need to use conventional tide gauges or to assign personnel to monitor tide staffs. Users must establish their own RTK base station to supply differential corrections to the boat-GPS. In addition, users must pre-determine the separation between the WGS-84 reference ellipsoid and the appropriate chart datum in their survey area.
This paper provides a step-by-step explanation of using RTK GPS to obtain real time water levels in HYPACK(TM).
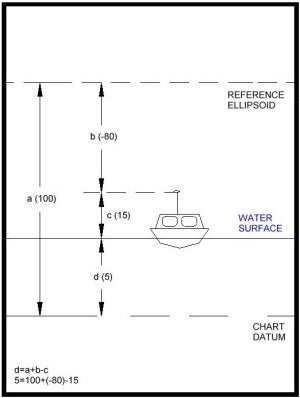
Figure 1: HYPACK(TM)'s method of obtaining real time water levels
Methodology
The figure to the right shows a survey boat using RTK GPS to determine the current water level correction.
Our measurements show the antenna height to be 15m above the static water line. This is the value (c) in the figure. c = 15.
The RTK GPS is reporting that the GPS antenna is 80m below the reference ellipsoid. This is value (b) in the figure. b = -80.
If we can determine how high the reference ellipsoid is above the chart datum [value (a)], we can then solve for the water level above the chart datum [value (d)].
In our example, we have pre-determined the reference ellipsoid is 100m above the chart datum. How we determined this is explained in the next section. From the diagram we can see that:
d = a + b - c
d= (100) + (-80) - 15 = 5m
Where (d) is the height of the water surface above the chart datum.
(a) is the height of the reference ellipsoid above the chart datum.
(b) is the height of the GPS antenna above the reference ellipsoid. This is supplied by your GPS.
(c) is the height of your GPS antenna above the static water line.
When correctly configured, HYPACK(TM) computes this value at each RTK GPS update and saves the position and a tide correction to the raw data file. The sign of value (d) is negated by HYPACK(TM) to be consistent with our normal tide correction values.
When the RAW data file from the SURVEY program is read into the Multibeam editor, each sounding will have an RTK Tide correction, based on the method shown above.
Determining the Separation between the Reference Ellipsoid and the Chart Datum
Before you head out on the water to start your survey, you need to determine the separation between the WGS-84 reference ellipsoid and the local chart datum. If your survey is conducted in a small area, you may need only a single point. If your survey is conducted over a large area where the separation between the ellipsoid and chart datum changes, you will need several points to Amodel@ the difference.
The following steps should be taken at each location to determine the separation between the reference ellipsoid and the chart datum.
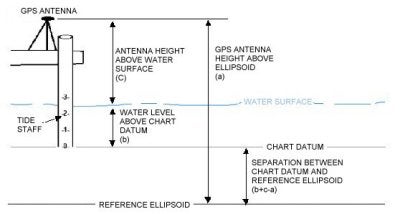
Figure 2: Determining the separation between the reference ellipsoid and the chart datum
Set up your GPS adjacent to your tide staff. The staff should be referenced to the local chart datum.
Write down the water level from the tide staff (b).
Measure the distance from your GPS antenna to the water level surface (c).
Once your GPS is stable and in RTK mode, write down the height of the GPS antenna above the reference ellipsoid. This is normally contained in the GGA and GGK messages. It might also be available on the front data display of some GPS. You should take care to note whether your GPS provides this value in feet or meters. If you are measuring depths in feet, you will need to convert the ellipsoid height of your antenna to feet. (1 meter = 3.280833333 feet). Record this value (a).
The height of the reference ellipsoid above the chart datum is equal to (b)+(c)-(a). In the diagram above, the reference ellipsoid is below the chart datum, so we would expect to get a negative number. The value will be a positive if the reference ellipsoid is above the chart datum and negative if the reference ellipsoid is below the chart datum.
Creating a KTD File
A Kinematic Tidal Datum (*.KTD) file is used in real time by the SURVEY program to determine the separation between the reference ellipsoid and the chart datum at the vessel location. This is used in cases where the separation between the two surfaces actually changes, depending on your location.
If the separation between your reference ellipsoid and chart datum is a constant, or if you are surveying in a small area and only want to use a single separation value, you do not need to make a KTD file. This is a new version of RTK Water Level implemented in HYPACK(TM) Version 8.1.a. and later. Details are presented in the next section.
To create a KTD file:
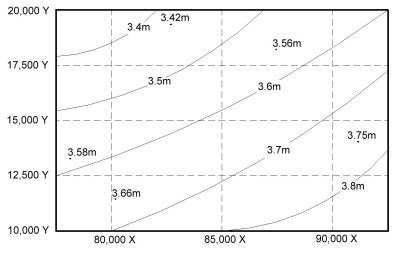
Figure 3: Separations: Ellipsoid above Chart Datum
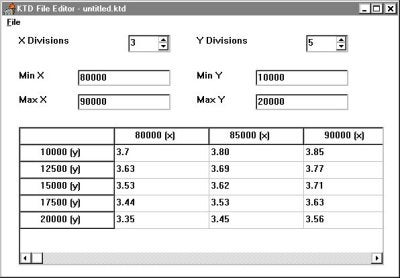
Figure 4: KTD File Editor
Plot your survey area on a piece of paper.
Plot the location of your tide stations, where you have determined the separation between the reference ellipsoid and the chart datum. Write the separation values next to each gauge.
Draw a rectangular grid around your survey area. This is the border of your KTD file. Make a note of the lower left X-Y and upper right X-Y coordinates. They will be needed when you create the KTD file.
Determine how many "nodes" you want in each direction. See the diagram to the right for an example. In this case, there are 3 nodes in the X-direction and 5-nodes in the Y-direction.
Contour the separation data, as shown in the figure to the right.
Determine a separation value at each node, based on the contour information.
Start the KTD File Editor. This program is only available in the 32-bit version of HYPACK(TM).
Enter the maximum and minimum values for your X and Y coordinates. These were obtained in step C.
Enter the number of nodes (or divisions) in each direction. The spreadsheet below will change to reflect the number you have entered.
Enter the separation value for each node in the appropriate grid.
When finished, click the File - Save and save the file to a KTD file. KTD files can be saved anywhere, but we normally put them in the \COASTAL directory.
In version 8.1 of HYPACK(TM) and earlier, users would enter a combined value that had the separation minus the static GPS antenna height. In Version 8.1.a. of HYPACK(TM) and later, you do not include the antenna height in the value entered in the KTD file. The TRIMKIN.DLL and KIN.DLL will obtain the antenna height from the offset information contained in the driver configuration.
Operating without a KTD File
As we mentioned before, a KTD file is only necessary if you are in an area where the separation between the reference ellipsoid and chart datum is not a constant. If the separation is a constant, or if your survey area is so small, you don't need more than a single value, you can operate without a KTD file.
You can "fool" the system by entering the combined value of your antenna height minus the height of the reference ellipsoid above the chart datum as the height in the "Offsets" window in HARDWARE for theTRIMKIN.DLL and KIN.DLL. This approach is only valid in HYPACK(TM) Version 8.1.a and later versions.
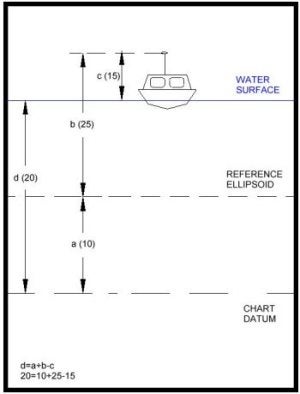
Figure 5: Operating without a KTD File.
For example, in the figure to the right, the antenna measures 15m above the static water line. The reference ellipsoid is 10m above the chart datum. We would enter 5.0 (15.0 - 10.0) as the antenna height and would not specify a KTD file.
While surveying, the SURVEY program receives a measurement from the RTK GPS, which shows the antenna is, located 25m above the reference ellipsoid. Since there is no KTD file, the program will assign zero to the separation value (a). Using our formula:
d = a + b - c
d = 0 + 25 - (5)
d = 20.
Using this technique, you don't have to mess with KTD files.
Setting up the Device Drivers to do RTK Real Time Water Levels
The KIN.DLL (Kinematic GPS) and TRIMKIN were written to provide real time water level capability in HYPACK(TM). You should configure them as you would any other GPS driver, with the following exceptions.
Make sure you have checked the "Tide" entry in the Type box. Otherwise, the driver will not perform the calculation to obtain a real time tide correction.
If you are using a KTD file, you need to select the KTD file in the Setup box.
・Make sure you specify the antenna height in the Offsets window. If you are using a KTD file, enter the height of the GPS antenna above the static water line. If you are working without a KTD file (see the section above), enter the height of the GPS antenna minus the height of the reference ellipsoid above the chart datum as your Antenna height.
Calibrating your Echosounder
In HYPACK(TM) version 8.1.a. and later, you should always calibrate your echosounder so the depth sent to the computer includes the measured depth from the transducer to the bottom, plus the transducer draft correction. In HYPACK(TM) version 8.1 and previous, you needed to have your echosounder output only the measured depth from the transducer face plate to the bottom.
Processing RTK GPS Data with Water Level Data
Provided you have correctly set up your survey to record real time water level corrections, processing is simple. The EDITOR program can read the raw format data file and use the TIDE records contained in the file automatically.
In the "Read Parameters" window, users can find the "Advanced" button. Clicking this button brings up access to the RTK Tide parameters. If the user clicks the RTK Tides check box, the EDITOR program will then use the RTK TIDE records written in the raw data file for tide corrections. This will activate the two options on how the program combines RTK water level elevations with heave corrections. The two choices will read:
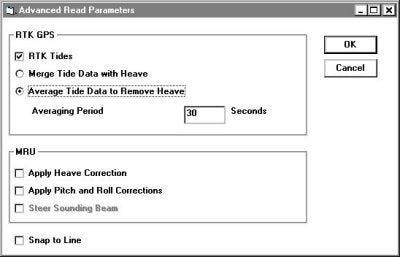
Figure 6: "Advanced Read Parameters" dialog box in the Editor program.
Merge Tide Data with Heave
Average Tide Data to Remove Heave
The "Merge Tide Data with Heave" uses the RTK elevations as vertical "anchors". Between the GPS elevation updates, the program "fits" the heave data to predict the change in vessel movement.
The Average Tide Data to Remove Heave averages the RTK elevations over a user defined time period to obtain a "normalized heave plane". In theory, this average vertical level should be the zero plane as defined by the heave-pitch-roll sensor. The program then applies the exact heave corrections to the data to obtain the exact vessel position at the time of the depth measurement. A time period of 30 seconds seems to work quite well.
Editing RTK GPS Data with Conventional Tides
Users can process raw data files that have RTK water level corrections using conventional tides by simply reading a TID file while in the EDITOR spreadsheet. This allows you to process the data using RTK water levels or conventional tide corrections and then compare the results in the CROSS SECTIONS program (or in the EDITOR profile screen by using the Overlay feature).